Analytics Design Framework
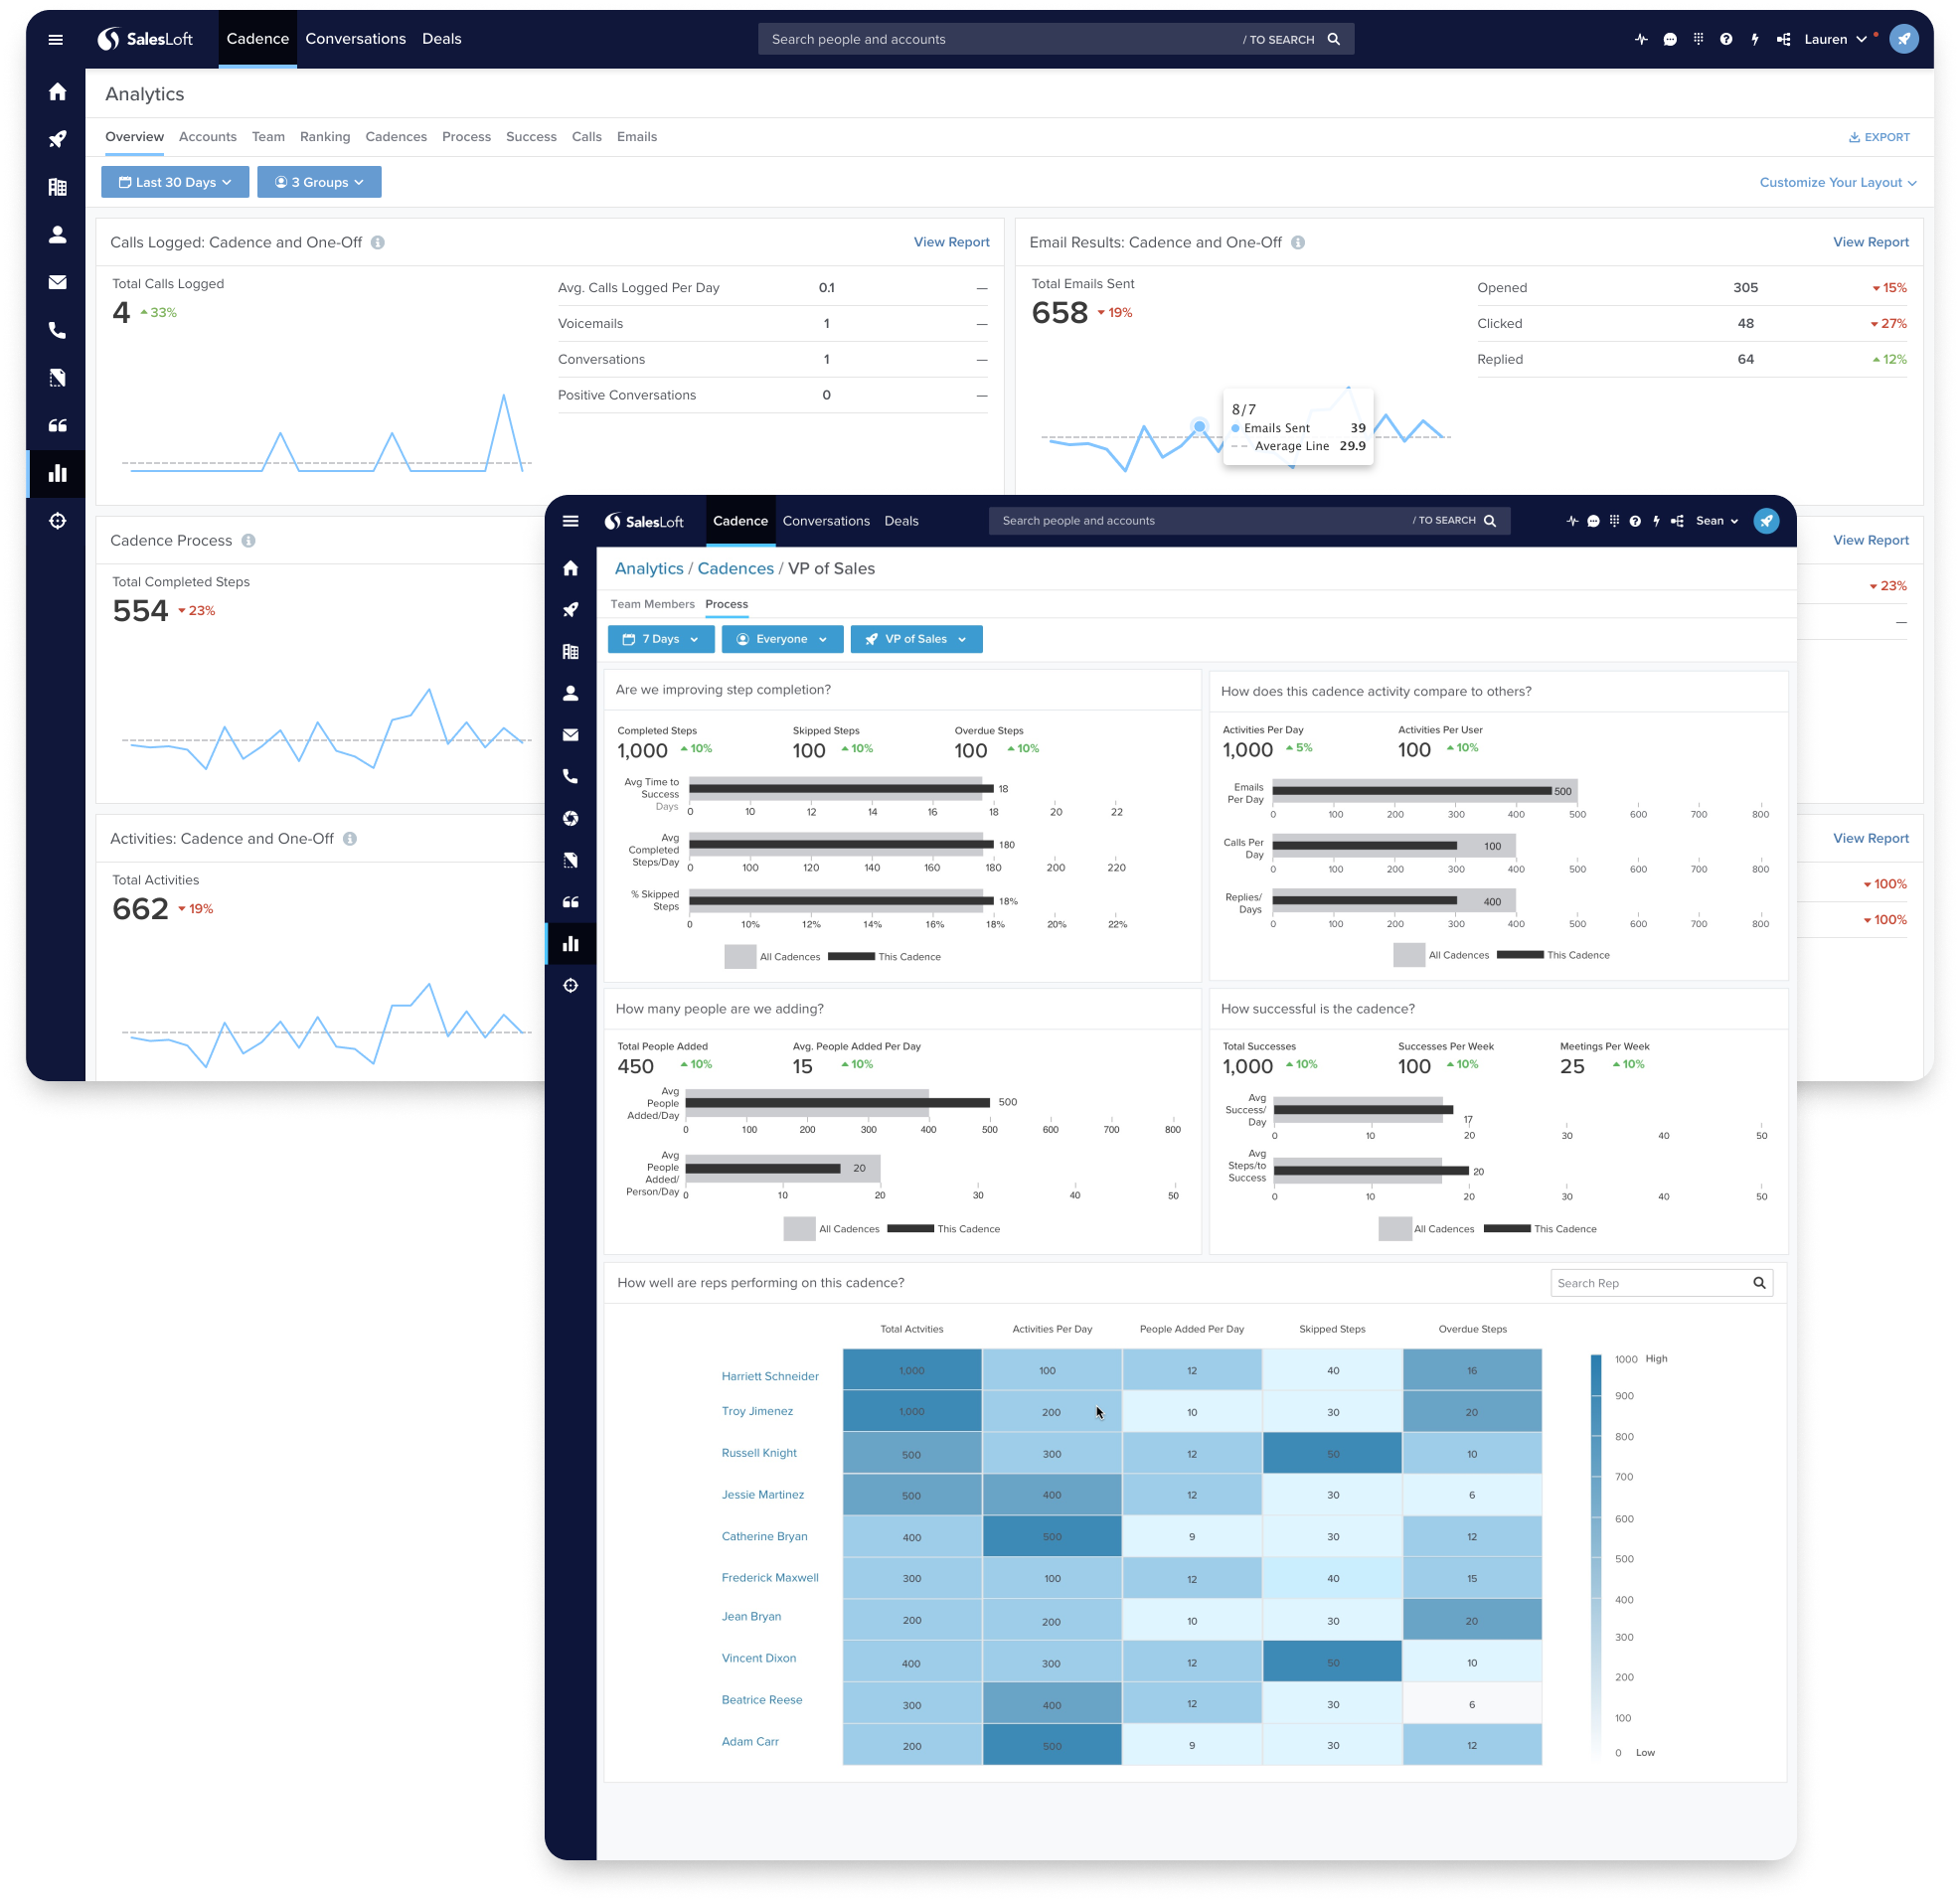
The SalesLoft platform's analytics section was receiving significant investment due to customer feedback highlighting its basic features compared to competitors. As our platform team worked on enhancing analytics, my product manager and I saw a chance to design a framework using our style guide and reusable components to speed up development and narrow the competitive gap.
Implement a system for reusable analytics elements to accelerate panel development.
Create components for our design library for seamless analytics integration across the platform.
Provide customers with visually digestible valuable insights.
Goals
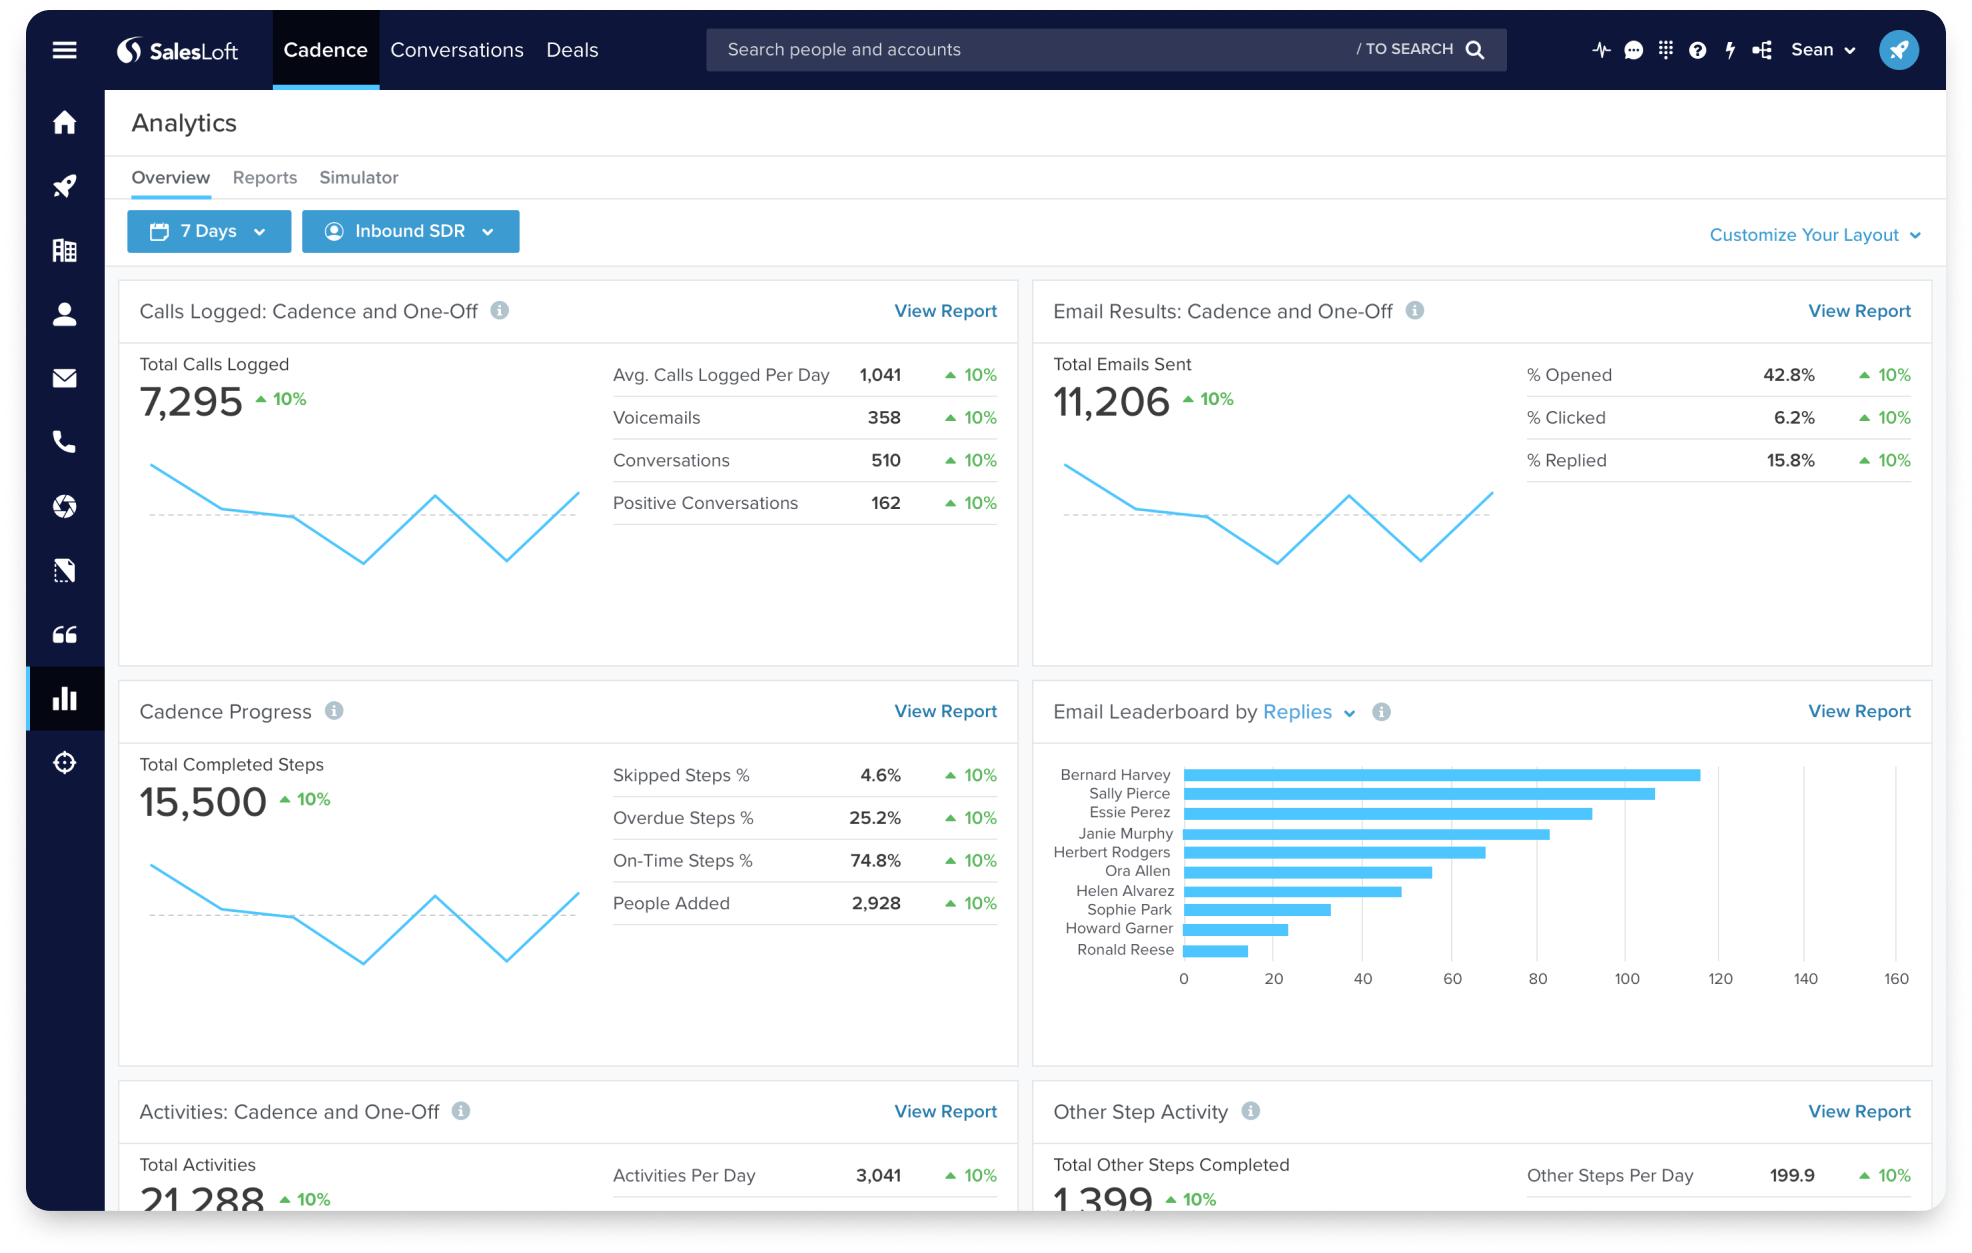
Incorporating UX research findings and guidance from Product Management, our strategy to enhance analytics involves providing users with broader data access and presenting more in-depth insights and trends for their most important metrics. This entails expanding our current basic data tables and metric scorecards into a comprehensive suite of dashboards featuring metrics and graphical representations.
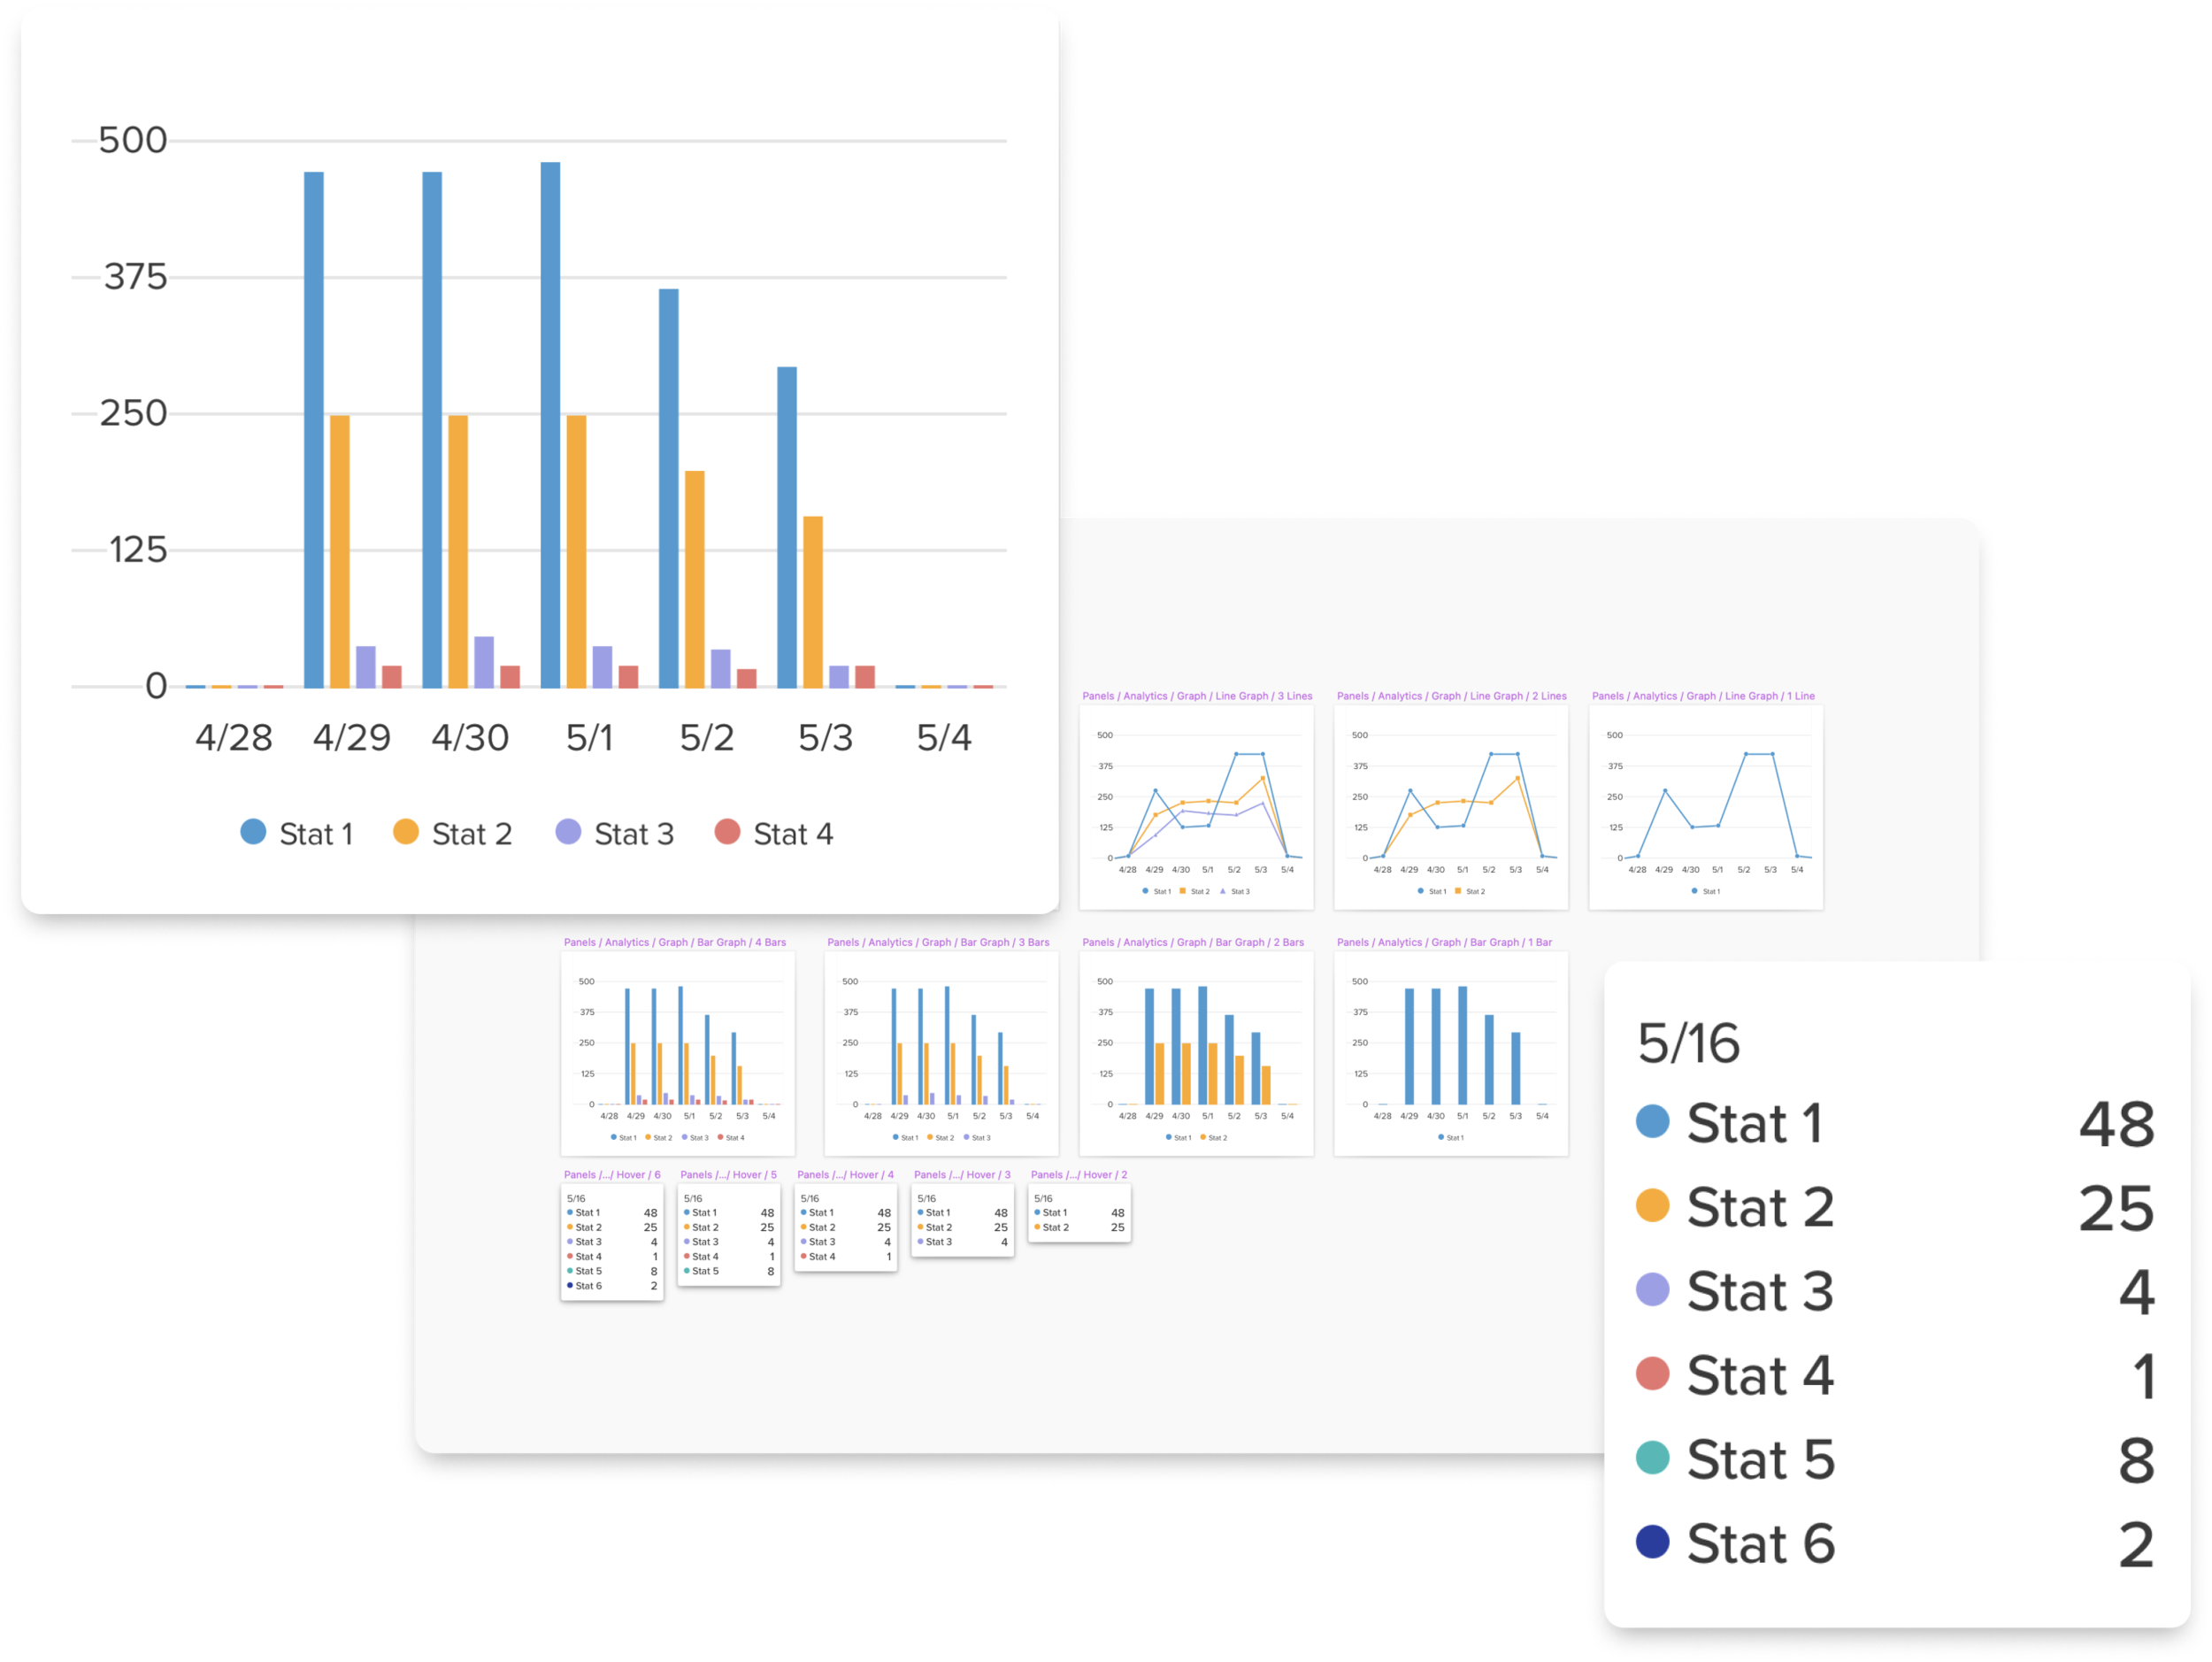
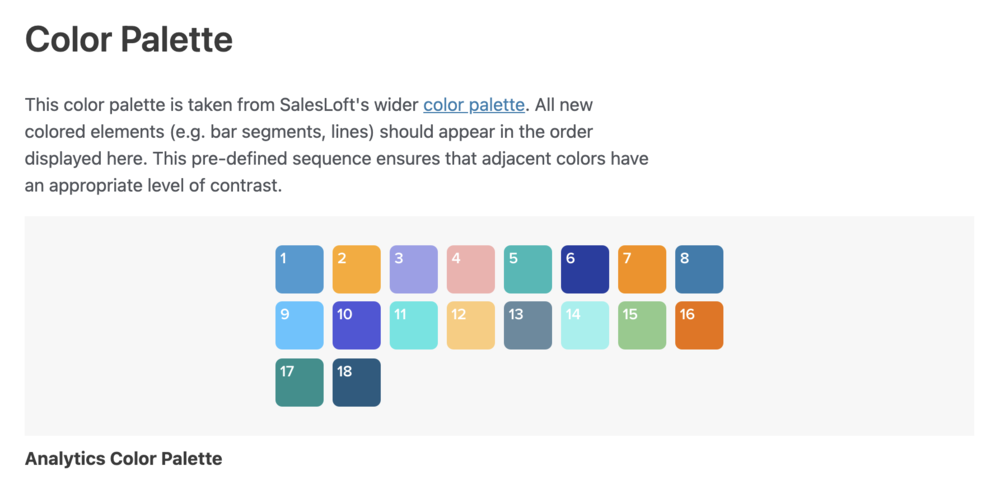
Evolving content requirements and creating a flexible color palette that had to accommodate up to 42 colors elongated design time. After 3 months of collaboration, my team and I developed adaptable panels and a color palette that assigned distinct hues to data points for better visual distinction. I closely worked with the engineering team to ensure the components aligned with our proposed designs.
Process
Evolving content requirements and creating a flexible color palette that had to accommodate up to 42 colors elongated design time. After 3 months of collaboration, my team and I developed adaptable panels and a color palette that assigned distinct hues to data points for better visual distinction. I closely worked with the engineering team to ensure the components aligned with our proposed designs.
The project team, consisting of a designer, design mentor, engineers, and a product manager, successfully realized a flexible, modular analytics framework that resonated with our customers due to its value and visual appeal. Following this release, SalesLoft's analytics reports and dashboards received higher ratings on G2 compared to our competitors.
By designing the analytics panels as reusable design and UI components, we empowered other SalesLoft delivery teams to swiftly integrate metrics into their respective product areas. This addition enhanced customer workflows by providing more data accessibility across the platform, further enriching their user experience.